Target audience: Administrators, Managers
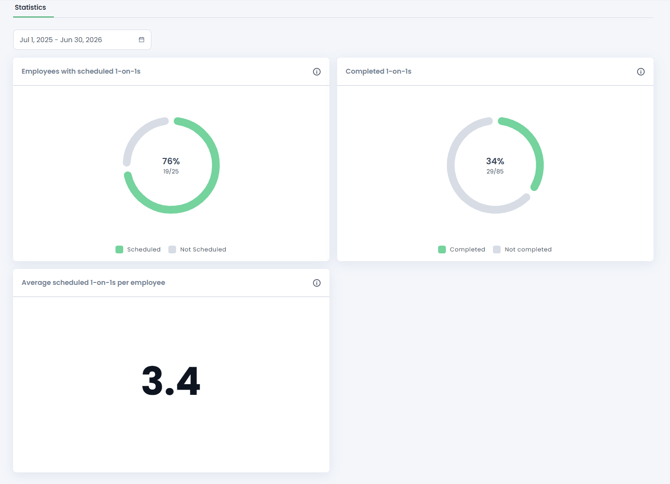
1-on-1s Statistics
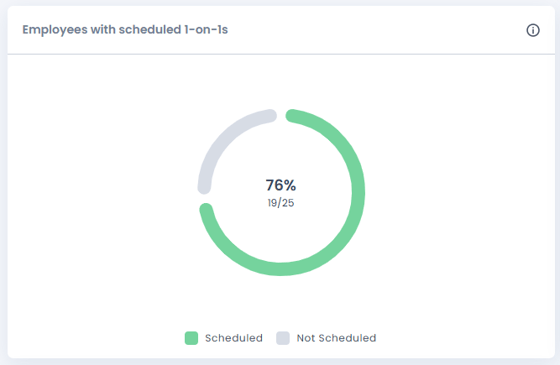
"Employees with scheduled 1-on-1s"
Measures the number and percentage of employees who have at least one 1-on-1 scheduled within the selected date range, regardless of which segment the meeting was booked in.
This metric tells you whether 1-on-1s are being applied broadly across the organization/segment or are concentrated to a few individuals, in other words, are we including everyone?
- High coverage: most employees have had at least one scheduled 1-on-1 in the selected period, indicating broad inclusion.
- Low coverage: a large share of employees have no scheduled 1-on-1 at all in the selected date range.
Follow Through
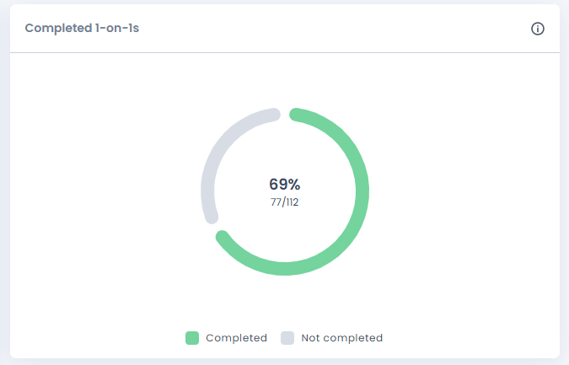
"Completed 1-on-1s"
Measures the number and percentage of all scheduled 1-on-1 meetings involving employees in the organization/segment that were marked as completed (i.e., ended by a user) within the selected date range.
This metric tells you whether scheduled meetings are actually taking place, not just being scheduled, are we doing what we plan?
- A high completion rate indicates good follow-through on manager-employee 1-on-1s.
A low completion rate can indicate that the manager or employee is not consistently ending/holding their meetings.
Average per Employee
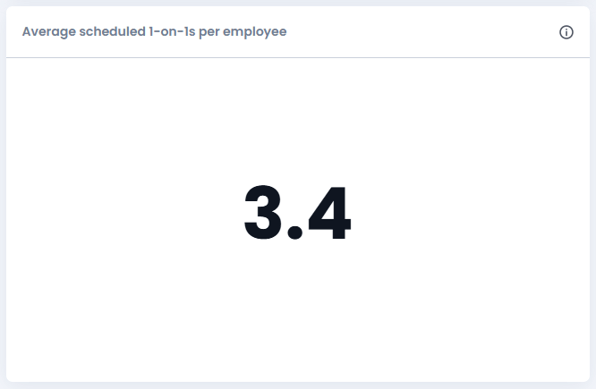
"Average 1-on-1s per employee"
Measures the average number of scheduled 1-on-1 meetings per employee in the organization/segment within the selected date range.
Calculation: Total scheduled meetings in ÷ Total employees during the period.
This shows meeting frequency, indicating how consistently employees are having 1-on-1s with their manager over time, how often does it happen?
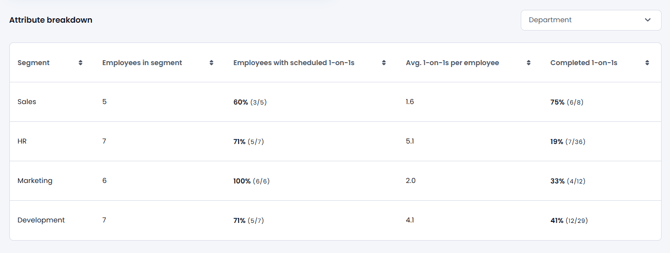
Attribute Breakdown
Only available on Organization level.
A table view that lets you see Coverage, Follow Through, and Average per Employee across several segments within an attribute at the same time. This is a useful way to identify segments that may need extra support when it comes to 1-on-1s.
Read more about 1-on-1s here: Create, schedule and perform 1-on-1 meetings